Brain Circuit Diagrams: Difference between revisions
Jump to navigation
Jump to search
Steven Gomez (talk | contribs) New page: {{stub}} ==Brain Circuitry Visual Representations== List of neural connectivity visualizations: * [http://wormweb.org wormweb.org] - Simple web graph visualization of neural cell connect... |
Steven Gomez (talk | contribs) |
||
| Line 7: | Line 7: | ||
[[Image:Worm_neural_net.png]] | [[Image:Worm_neural_net.png]] | ||
==Mock-up/Sketches== | |||
;steveg: | |||
{| cellpadding=10 | |||
|Here's a very quick sketch of the way I imagine an application like this working, using a split view that gives an anatomical reference for brain circuits on one side and a more abstract and distilled graph representation on the other. This is similar to both Radu's and Cagatay's work dual view work with the tractography images and to the wormweb.org reference above. Here are a few notes I had scribbled down: | |||
* What are all query types a user might want? Two important questions seem to be ''"Does a projection from x to y exist?"'' and ''"What projections exist from/to this region or cell type?"'' What other features are needed? | |||
* I think the left side of this sketch could be a 3d model, something that looks like the streamtubes visualizations and interacted with similarly (rotation about arbitrary axis?). Maybe the interaction is limited to picking from some standard orientations (sagittal, coronal, axial, ...). The user should be able to easily identify the connection if it exists, but what else could we show to aid in hypothesis generation? In my sketch, the bold blue line shows an ''existing'' connection between two brain areas, and other connections at either end point are also drawn in faintly. Maybe that gives some local context to help the user understand the results (more so than cramming every other connection into the picture and creating clutter, or than showing no other connection data). | |||
* On the right is a radially laid out graph representation corresponding to the left side query/result (not actually consistent in this sketch, though!). The ''depth'' of a node away from a source is equal to the length of the shortest path of connection between those nodes in the brain circuit. I've used color to indicate this depth (you would also get that from shape in this scheme). The edges could be colored or textured based on the projection strength between nodes, which is available in some of the collated datasets. This layout seems reasonable because (from Jeff's email) it sounded like they don't expect to explore projections that are more than a few steps deep. I see this as being useful for fine-scale interaction and understanding, where the whole-brain diagram is coarse. Thinking about it this way, we could also have a "maps"-style control for the coarseness or amount of abstraction in the diagrams, or for a threshold if we hierarchically cluster these brain region nodes before drawing them. | |||
|| [[Image:Steveg_brain_sketch.jpg|300px]] | |||
|} | |||
[[Category:Projects]] | [[Category:Projects]] | ||
Revision as of 03:04, 1 June 2010
Brain Circuitry Visual Representations
List of neural connectivity visualizations:
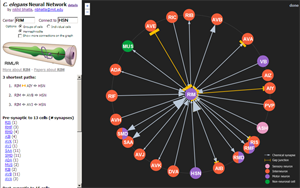
- wormweb.org - Simple web graph visualization of neural cell connections in the nematode. Nodes link to textual db entries with curation/experimental info. Made by Nikhil Bhatla, a current Brain and Cognitive Sciences grad student at MIT.

Mock-up/Sketches
- steveg
Here's a very quick sketch of the way I imagine an application like this working, using a split view that gives an anatomical reference for brain circuits on one side and a more abstract and distilled graph representation on the other. This is similar to both Radu's and Cagatay's work dual view work with the tractography images and to the wormweb.org reference above. Here are a few notes I had scribbled down:
|

|