Brain Circuit Diagrams
Brain Circuitry Visual Representations
List of neural connectivity visualizations:
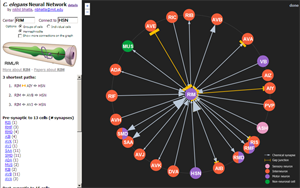
- wormweb.org - Simple web graph visualization of neural cell connections in the nematode. Nodes link to textual db entries with curation/experimental info. Made by Nikhil Bhatla, a current Brain and Cognitive Sciences grad student at MIT.

Requirements Doc
Purpose
The purpose of this tool is to bring together multiple sources of knowledge about the brain circuit as easy-to-interpret context for hypothesis generation. These sources of knowledge include functional neuron projections, axonal connections via DTI, and the organization of known systems/complexes. The integration of these connectivity data will use the 3D anatomical layout of the brain as a common frame of reference for interacting with and representing these connections.
Requirements
Multi-modal Integration
The tool must be able to combine different levels of connectivity seamlessly, from the organization of brain regions to the shape and properties of white matter connections, as well as the functional projection circuit. To the extent that it is possible, visual representations for these data must be visible simultaneously so as to provide a global context for understanding the connectedness of a particular brain part.
Putting Experimental Data in the Context of Curated Circuit Knowledge
Users should be able to load experimental data (e.g., fMRI time series, DTI) that is independent of curated types (e.g., functional connections, ``reference" DTI). The curated knowledge is used to provide context for insights about the experimental data. This may involve spatially registering curated connections with the instance-specific experimental data.
Accessibility
The tool must be easy to learn, use, and deploy. The code must be extensible for new interactions, representations, or data types.
Support for Refinement of Analyses
The tool must support users' efforts to discover, store, and refine scientific analyses over multiple time scales.
Tool Sketches
We have sketched some different tool designs that address these requirements. One creates 2D projections from the 3D brain data as combinable ``layers"; the other draws connections in a 3D brain-shaped volume that can be freely rotated and zoomed in/out. The advantage of flattened layers is that interaction and representation in a third dimension is side-stepped, which may be ideal when depth information isn't critical. In this model, we note, all spatial brain data is still stored in 3D, which is needed to render accurate 2D layers from arbitrary projections. The advantage of a 3D rendering is that there is no loss of information in the visual mapping of (what is inherently) 3D data. We also discuss some mechanisms that can be integrated into either approach.
Multiple linked layers
Below, we show a map with ``linked layers" that builds off both an earlier prototype of a functional connectivity diagram and a neural ``Google map" that shows major white matter fiber bundles flattened into 2D. In this sketch, the user creates multiple separate views, which we think of as layers because each is overlaid on the same projection of the brain anatomy. One may be a tractogram map, as in Jianu's work. Another is the neuron projection graph, which we get by flattening the 3D locations of brain areas into the reference projection then drawing a node-link diagram in 2D.
Similarly, we can flatten major brain regions into a region map. Selecting regions in this layer might dictate filters for the projection graph, which is why we call this ``linked layers". We also support different levels of abstraction within layers. For instance, when specific regions are selected, aggregate projection statistics between these regions are shown in the projection layer, but these can be expanded to view individual area projections.
The top navigation bar shows glyphs for sagittal, axial, and coronal projections that the user can switch between quickly. There is also the user-adjustable stack that describes the top-to-bottom prioritization order between layers in the combined view. While not shown, these layers can also be popped from the stack and rendered separately as small linked views.
- Mock-up screens of the layered model
-
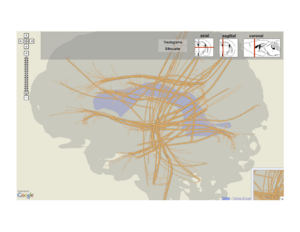 Anatomical context
 -
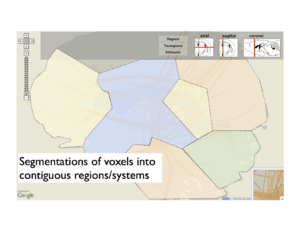 Subdivision into major regions
 -
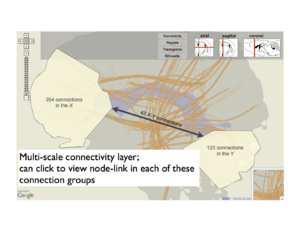 Connections between systems or regions
 -
 Inspecting individual connections


Above: A layer-based visualization model. (a) shows a flattened view of a 3D reference brain volume and flattened white matter bundles. (b) shows a layer created by flattening a brain volume that's segmented into regions. These regions add visual context and give the user a spatial abstraction for interaction with the circuit, e.g. filtering by region. (c) and (d) show multi-scale functional connectivity; aggregate connection statistics between groups of brain parts illuminates relationships between functional complexes, and can be expanded to view individual projections.
Brain volume
An alternate approach is to render region and connection information inside a transparent brain volume that can be filtered. Interactions are used to build the model from the ground up -- rather than rendering all connection info at once -- as a means of reducing visual complexity. For instance, the user can query specific parts or regions by keyword, and these are rendered. This works together with a recommendation system that will suggest additional parts or regions to add. As shown in the sketch, these recommendations are made based on user-defined constraints (e.g., areas with high projection degree or in certain systems) and are rendered faintly (dotted line) in the current model until either ignored or added to the growing visualization, which we can think of as a complex of parts and regions that an investigator might be forming a hypothesis about.
Because the user builds the complex from nothing, the challenge for the user is setting recommendation filters that won't preclude the ``unexpected insights" that visualization enables.

Above: This sketch suggests drawing all connection info in the spatial extent of a transparent 3D brain volume. To address the high visual complexity, a recommendation system helps the user filter and grow the visual circuit. Like the layers sketch, the user can snap to common views of the volume, or freely rotate/zoom on the brain and store these views.}
Dynamic grouping
The previously mentioned recommendation system could also be integrated with linked layers. Another feature that works with both approaches is dynamic grouping, or the ability to select and label complexes of arbitrary elements, including projections, parts and regions. These groupings are then treated as first-order objects in other filtering mechanisms. Fig.~\ref{fig:groups} shows and example of group creation, and the use of these groups in filtering connection data. Here we show how a group (along with user-selected logical operators) can filter either a node-link diagram of neuron projections or a rendering of tractograms (again, in 2D or 3D).
Dynamic groups can be saved and shared between users, and can be refined over time to support hypothesis generation and investigation.
Above: IIn either a ``pure" 3D view or the layer view, users can group brain areas arbitrarily to create custom filters or to support hypotheses about complexes in the circuit. These groups and other entities (like individual parts or regions) can be combined with associative operators (AND, OR) to create rules for filtering. We show an example of this with filtering the functional circuit as well as DTI stream tubes that pass through the spatial extent of these entities.
Use Scenarios
``This area seems relevant to my research on human vision..."
John is studying neurological impairments that affect visual processing. He would like to view neuron projections from external areas to areas within the visual cortex. He knows a priori that some brain areas are not affected by the conditions he is studying.
John begins by opening the layered view tool and selecting the primary visual area (V1) and the lateral geniculate nucleus (LGN), by searching in a text box for these parts. He can also select the sagittal view of the brain and hover the cursor over the known location of these areas -- they appear under this ``spotlight" and can be selected with a mouse click. Selecting the ``Connections" layer, known projections between these areas are drawn and can be clicked to link to curated info or PubMed documents that describe these areas/connections.
To broaden the network shown, John filters for all projections coming into V1 and LGN. He knows some areas, like the auditory cortex, may be irrelevant to the condition he is studying, so he filters these out by typing area names or selects regions in the map (region layer) to remove these visually from the diagram.
Isolating dysfunctional neural mechanisms from DTI
Jane has a series of diffusion MRI images from a subject with condition X, which causes severe degeneration of neural white matter. Her goal is to identify which functional systems in the brain are affected by this degeneration.
Using the brain volume tool, Jane can load her DTI scans and register them with reference tractograms and the functional circuit diagram, fitting the node-link diagram into the 3D space of the condition X tractography. Jane visually identifies where fiber bundles are heavily perturbed from the reference `normal' tractography; these regions are illuminated by a coloring scheme that uses a shape difference metric with the reference tractography. Furthermore, Jane sees which parts and functional connections are drawn over these perturbed regions that hint at specific sources for the cognitive problems attributed to condition X.
Data foraging for a new hypothesized complex
Jesse and her collaborators are studying both internal and external connectivity of newly explored complexes in the human brain.
Jesse first begins by using grouping tool in the visualization to build and label groups of brain parts that represent the information processing complexes her research has suggested. She can visualize the spatial extent of these complexes in 3D and view curated projections between these parts. In addition to viewing projections between individual parts in these complexes, Jesse can switch to a more abstract view that shows aggregate connectivity information between multiple complexes, each with a unified function (see Fig.~\ref{fig:aggregate}).
These group definitions are saved when Jesse's session ends. If more connections are added to the backing databases (for instance, if more projections in these areas are discovered), they will be drawn the next time these groups are visualized. These definitions can also be shared with other users (on disk, or by URL with a web client) and refined over time. A change log of user-defined groups will be stored automatically with annotations, and groups can be versioned and ``rolled back" to previous states to support hypothesis generation and exploration as the scientific analysis continues.
Prototype from Schnitzer Group
The Schnitzer group from Stanford have developed a brain circuit diagram mindmap using MindManager. The mindmap file can be found here: [2.zip]. You will need to change the filetype to .mmap after downloading the file. The file can be opened in read-only mode using MindManager Viewer (available from http://www.mindjet.com/support/tutorials/viewer). There is also a pdf version of the mindmap([[1]]), and a document ([[2]]) describing the structure, references and connectivity information incorporated in the mindmap.
Web-based prototype
A web-based prototype written in Javascript and the d3 library is available at http://hivizexplorer.com
Use Cases
Supported
- 1. The user can specify two brain regions of interest and search for the known connections between the two. Each connection comes with a set of information, including connection strength, technique, associated pubmed literature etc.
- 2. The user can specify one brain region and see all the connections going into or coming out of that region.
Future potentials
Integrate experiment data, hypothesis and known connections
One potential use case is that when a user has used the tool to form a hypothesis and obtained some experiment data about the brain connections that he has hypothesized, he will want to check which existing literature supports / disagrees with his finding and / or good ways to explain the obtained connections. One potential improvement for the tool would be to allow the user to upload their data and let the tool provide information related to above-mentioned questions based on information stored in the database.
Visualizing uncertainties
Many data from science domain involve uncertainty, and brain connectivity data are no exception. Information about a connection reported twenty years ago might be overridden by newly developed, more accurate techniques. Also, it might be important for some brain scientists to be able to distinguish between connections that are shown to be non-existent and possible connections that are just not tested yet. (Originated from discussion with Steven Sloman)
Heatmap showing recommended brain regions
This is one example where we could incorporate machine learning and community effort to assist brain scientist in their research. When a user has obtained information displayed by the system about one or several brain regions of interest (e.g., he might get a set of regions that are known to connect to one particular region of interest, or a set of regions that are known to act as intermediate regions that connect two brain regions that the user is interested in ), it is likely that he will need to narrow the result. The tool could assist this process by integrating community knowledge, e,g, present to the user visually which brain areas are more likely to be relevant given the user's interest based on analysis histories of other users. (Originated from discussion with Steve Gomez).
Show connectivity among multiple brain regions
While some brain scientists study connectivity among major brain regions, some others study the brain as a small world network that might consist hundreds of smaller brain regions (or neurons). In this case, a user might be interested in the connectivity among a group of nodes instead of two nodes. A possible improvement would then be able to display a sub-graph given an arbitrary number of brain regions.(Originated from discussion with David Badre)
Focus + context
Cognitive experiments
Here are some ideas for experiments about human cognition that could potentially be done in the context of the brain circuit tool:
1. The effect of presenting an anatomical reference
The importance of "context" is often emphasized and requested by visualization users, especially by users working in science domains where they have already had conventional ways of drawing diagrams or reference systems. When constructing a representation of the brain circuit, for example, users often suggest using an anatomical model to represent the brain instead of using an abstract representation (e.g., a node link diagram), or at least provide an anatomical model in addition to the abstract representation. What exactly is the effect of having a representation that the users are familiar with, though? Which tasks benefit a lot from a familiar representation and which do not (if any)? To what extent could the advantage of using a familiar representation be attributed to a reduced learning curve? Does the advantage of a familiar representation diminish over time? Does a familiar representation benefit a user in some other way other than reducing learning effort? Will a user feel more confident when the visualization uses a familiar representation? Will that alone affect the analysis process? Experiments that address these questions might help generate design recommendations about the choice of visual representation, especially when a conventional representation is not optimal from a visualization perspective.