CS295J/Project Schedule:HG-DT: Difference between revisions
< CS295J
| Line 48: | Line 48: | ||
=== Visualization Tool Feature List === | === Visualization Tool Feature List === | ||
Objective Feature | |||
Allowing fast generation of temporal signal | |||
Allowing fast generation of spatial pattern | |||
Allowing fast comparison of two temporal signal | |||
Allowing fast comparison of two spatial pattern | |||
=== Visualization Tool UI Sketch === | === Visualization Tool UI Sketch === | ||
Revision as of 15:07, 15 November 2011
Design & Evaluation of EEG Data Visualization Tool Based on Cognitive Task Analysis
Project Schedule
Week 1: 10/25 - 11/1
- Preliminary task decomposition (list and diagram)
- Refined related work section with related work on high dimensional data visualization
Week 2: 11/1 - 11/8
- Refined (hopefully final) task decomposition
- Complete related work section
- Feature list of the visualization tool
- Sketch of the interface of the visualization tool
Week 3: 11/8 - 11/15
- List of features / ideas to be implemented by the end of the 50-days
- Interview report of other potential users
Week 4: 11/15 - 11/22
- Visualization tool prototype
- Evaluation plan
Week 5: 11/22 - 11/29
- User feedback on the prototype
- First feature implemented
Week 6: 11/29 - 12/6
- Second feature implemented
Week 7: 12/6 - 12/13
- Two-page abstract
Interview Reports
Interview with Jim Cavanagh on his EEG Data Analysis Task
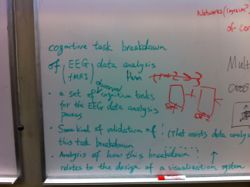
Task Decomposition
Preliminary Decomposition

Final Task Decomposition
Visualization Tool Design
Visualization Tool Feature List
Objective Feature
Allowing fast generation of temporal signal Allowing fast generation of spatial pattern Allowing fast comparison of two temporal signal Allowing fast comparison of two spatial pattern
Visualization Tool UI Sketch
Preliminary Sketches on Board
-
 Oct 13, 2011: Title and Results Sketch
 -
 Oct 13, 2011: Title and Results Sketch
 -
 Oct 18, 2011
 -
 Oct.20, 2011


