CS295J/Project Schedule:HG-DT: Difference between revisions
< CS295J
| (25 intermediate revisions by the same user not shown) | |||
| Line 1: | Line 1: | ||
= Design & Evaluation of EEG Data Visualization Tool Based on Cognitive Task Analysis = | = Design & Evaluation of EEG Data Visualization Tool Based on Cognitive Task Analysis = | ||
[https://docs.google.com/document/d/1JkBLdCf4kZAuE1W88tvCQCso5NLhZFrjmel56FynrMg/edit?hl=en_US Google Doc for the Project] | |||
== Project Schedule == | == Project Schedule == | ||
| Line 36: | Line 38: | ||
== Task Decomposition == | == Task Decomposition == | ||
=== Preliminary Decomposition === | |||
[[Image:EEGDataAnalysisWorkFlow1.jpg|400x300px]] | |||
=== Final Task Decomposition === | |||
[[Media:EEGTD.odt]] | |||
== Visualization Tool Design == | == Visualization Tool Design == | ||
| Line 41: | Line 51: | ||
=== Visualization Tool Feature List === | === Visualization Tool Feature List === | ||
=== Visualization Tool UI Sketch === | The features are designed to serve performance gain from three aspects: visualization generation, visualization comparison and context-switch between visualizations. | ||
{| class="wikitable" style="text-align:left" | |||
|- | |||
! scope = "col" | Objective | |||
! scope = "col" | Feature | |||
|- | |||
| Allowing fast generation of temporal signal | |||
| Interactive spatial pattern visualization that allows a user to generate temporal signal by clicking on the position of a electrode | |||
|- | |||
| Allowing fast generation of spatial pattern | |||
| Real-time switch between different epochs with slider | |||
|- | |||
| Allowing fast generation of power/phase pattern | |||
| One-click generation of power/phase pattern corresponding to currently selected time and electrode | |||
| | |||
|- | |||
| Allowing fast comparison of two temporal signal | |||
| Option of displaying two temporal signal side-by-side | |||
|- | |||
| Allowing fast comparison of two spatial pattern | |||
| Option of displaying two spatial pattern side-by-side | |||
|- | |||
| Allowing fast context-switch between different visualizations | |||
| Layout design that minimizes estimated total eye movement distance (for a given session? can we make this adaptive?) | |||
|} | |||
=== Visualization Tool UI Sketch and Interaction === | |||
[[Image:EEGVisToolSketch 1.png | 400x300px]] | |||
== Evaluation == | |||
:Task: In 5 minutes, try to find interesting pattern(s) in the given data that may lead to new hypothesis or scientific discovery. | |||
:Measurement: | |||
:1. Number of time signals examined. | |||
:2. Number of topographies examined. | |||
:3. Questionnaire that measures cognitive load while completing the task. | |||
:4. Number of interesting patterns discovered. | |||
:5. Number of noisy data discovered. | |||
== Preliminary Sketches on Board == | == Preliminary Sketches on Board == | ||
| Line 49: | Line 98: | ||
Image:DiemTranWeek7.JPG | Oct 13, 2011: Title and Results Sketch | Image:DiemTranWeek7.JPG | Oct 13, 2011: Title and Results Sketch | ||
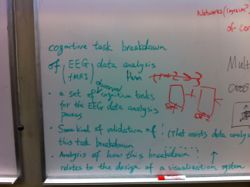
Image:HuaProjectSketch.jpg | Oct 13, 2011: Title and Results Sketch | Image:HuaProjectSketch.jpg | Oct 13, 2011: Title and Results Sketch | ||
Image:HuaProjectSketch1. | Image:HuaProjectSketch1.JPG | Oct 18, 2011 | ||
Image:HuaDiemProjectSketch1. | Image:HuaDiemProjectSketch1.JPG | Oct.20, 2011 | ||
</gallery> | </gallery> | ||
</center> | </center> | ||
Latest revision as of 16:58, 6 December 2011
Design & Evaluation of EEG Data Visualization Tool Based on Cognitive Task Analysis
Project Schedule
Week 1: 10/25 - 11/1
- Preliminary task decomposition (list and diagram)
- Refined related work section with related work on high dimensional data visualization
Week 2: 11/1 - 11/8
- Refined (hopefully final) task decomposition
- Complete related work section
- Feature list of the visualization tool
- Sketch of the interface of the visualization tool
Week 3: 11/8 - 11/15
- List of features / ideas to be implemented by the end of the 50-days
- Interview report of other potential users
Week 4: 11/15 - 11/22
- Visualization tool prototype
- Evaluation plan
Week 5: 11/22 - 11/29
- User feedback on the prototype
- First feature implemented
Week 6: 11/29 - 12/6
- Second feature implemented
Week 7: 12/6 - 12/13
- Two-page abstract
Interview Reports
Interview with Jim Cavanagh on his EEG Data Analysis Task
Task Decomposition
Preliminary Decomposition

Final Task Decomposition
Visualization Tool Design
Visualization Tool Feature List
The features are designed to serve performance gain from three aspects: visualization generation, visualization comparison and context-switch between visualizations.
| Objective | Feature | |
|---|---|---|
| Allowing fast generation of temporal signal | Interactive spatial pattern visualization that allows a user to generate temporal signal by clicking on the position of a electrode | |
| Allowing fast generation of spatial pattern | Real-time switch between different epochs with slider | |
| Allowing fast generation of power/phase pattern | One-click generation of power/phase pattern corresponding to currently selected time and electrode | |
| Allowing fast comparison of two temporal signal | Option of displaying two temporal signal side-by-side | |
| Allowing fast comparison of two spatial pattern | Option of displaying two spatial pattern side-by-side | |
| Allowing fast context-switch between different visualizations | Layout design that minimizes estimated total eye movement distance (for a given session? can we make this adaptive?) |
Visualization Tool UI Sketch and Interaction

Evaluation
- Task: In 5 minutes, try to find interesting pattern(s) in the given data that may lead to new hypothesis or scientific discovery.
- Measurement:
- 1. Number of time signals examined.
- 2. Number of topographies examined.
- 3. Questionnaire that measures cognitive load while completing the task.
- 4. Number of interesting patterns discovered.
- 5. Number of noisy data discovered.
Preliminary Sketches on Board
-
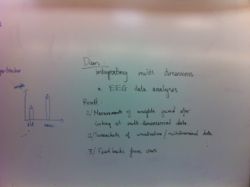 Oct 13, 2011: Title and Results Sketch
 -
 Oct 13, 2011: Title and Results Sketch
 -
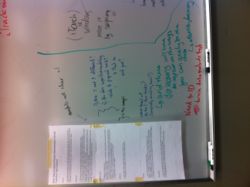 Oct 18, 2011
 -
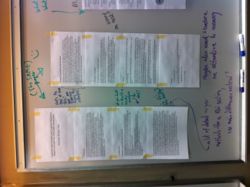 Oct.20, 2011


